Detroit Department of Transportation (DDOT)
Maps / Schedules / Calendars
I’ve held the position of Graphic Designer at the Detroit Department of Transportation (DDOT) in the Scheduling and Service Development division since 2019.
DDOT is the largest public transit provider in Michigan. It serves the city of Detroit, surrounding suburbs, and neighboring cities, including Highland Park and Hamtramck. DDOT serves an average of 85,000 riders daily.
Bus Schedules | System Map | Bus Stop Signs | Outreach | Data Analysis
Daily Operations Analysis
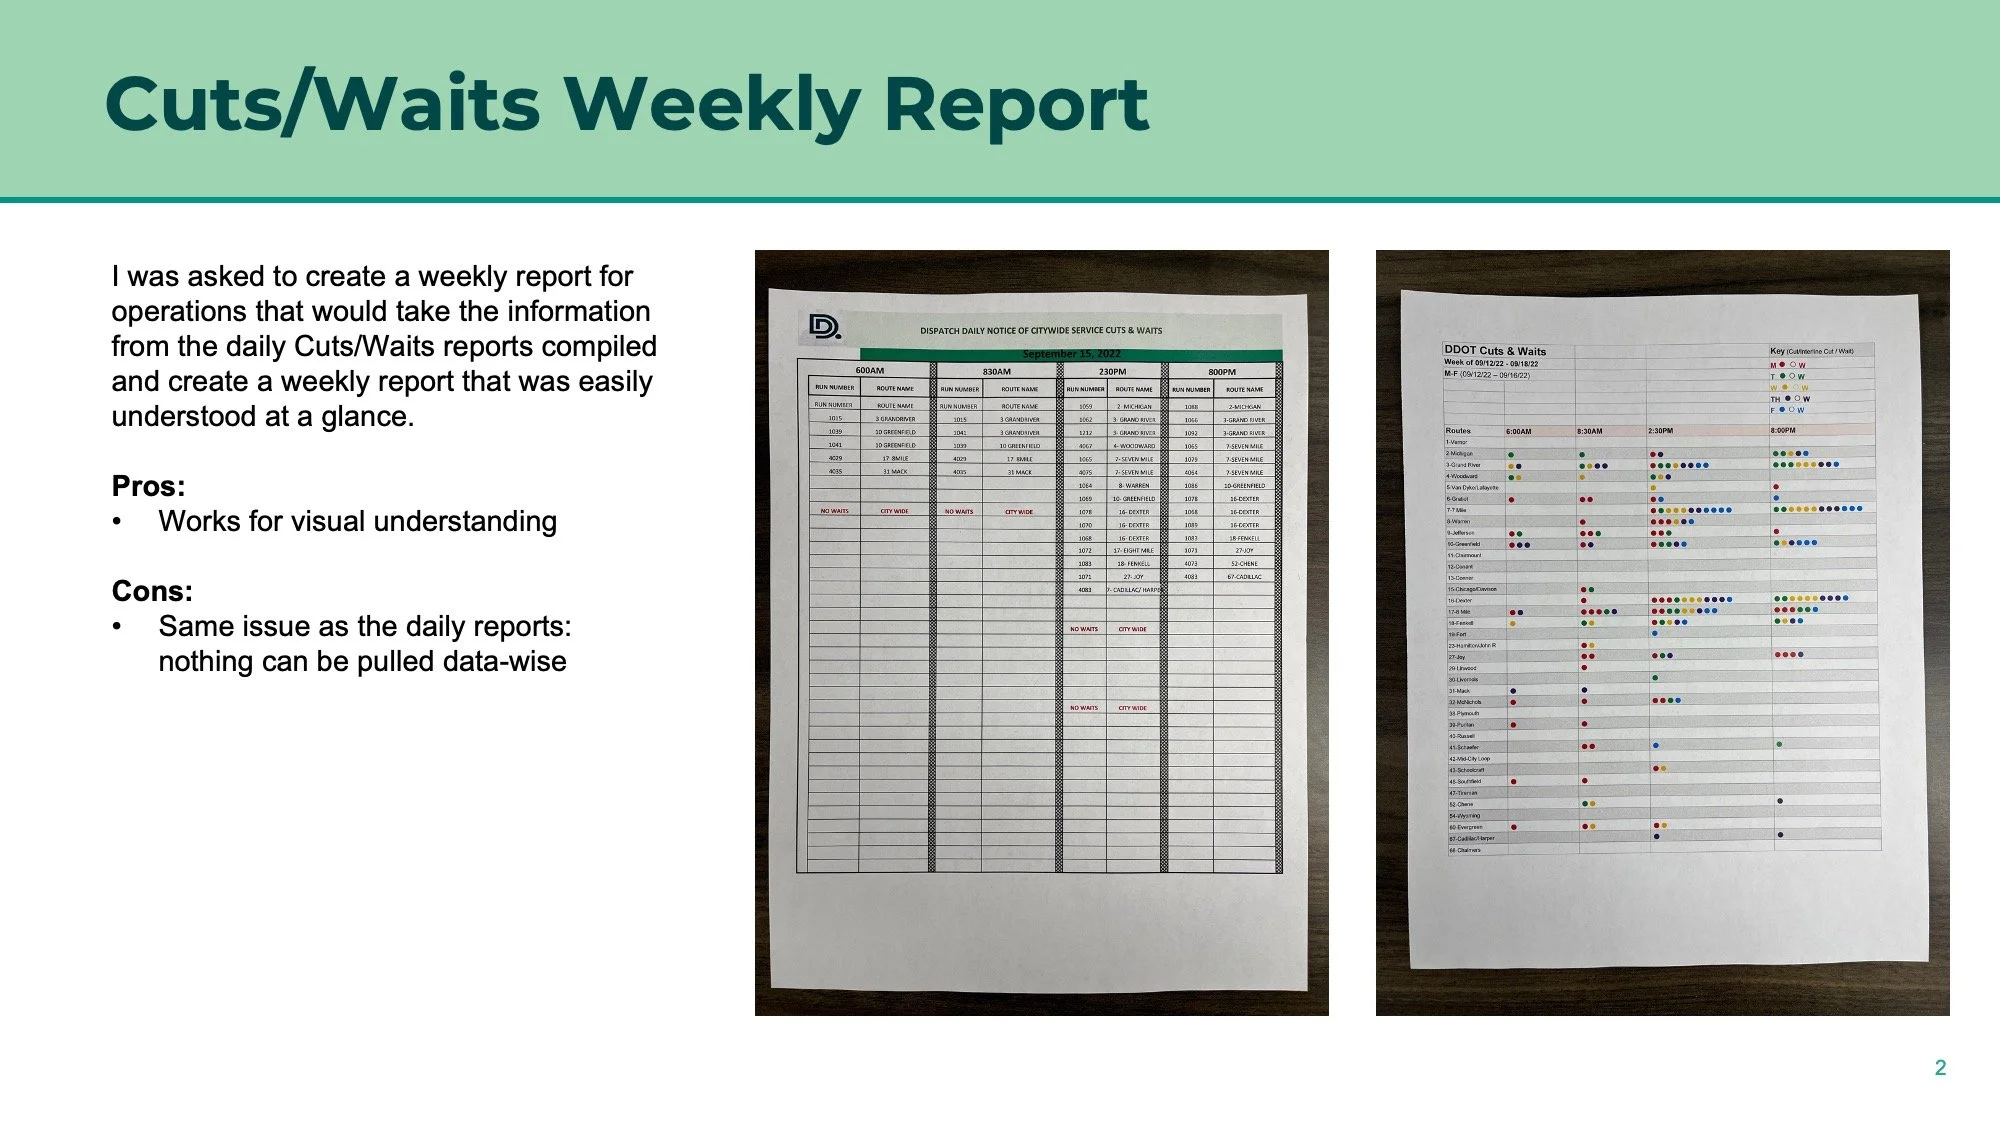
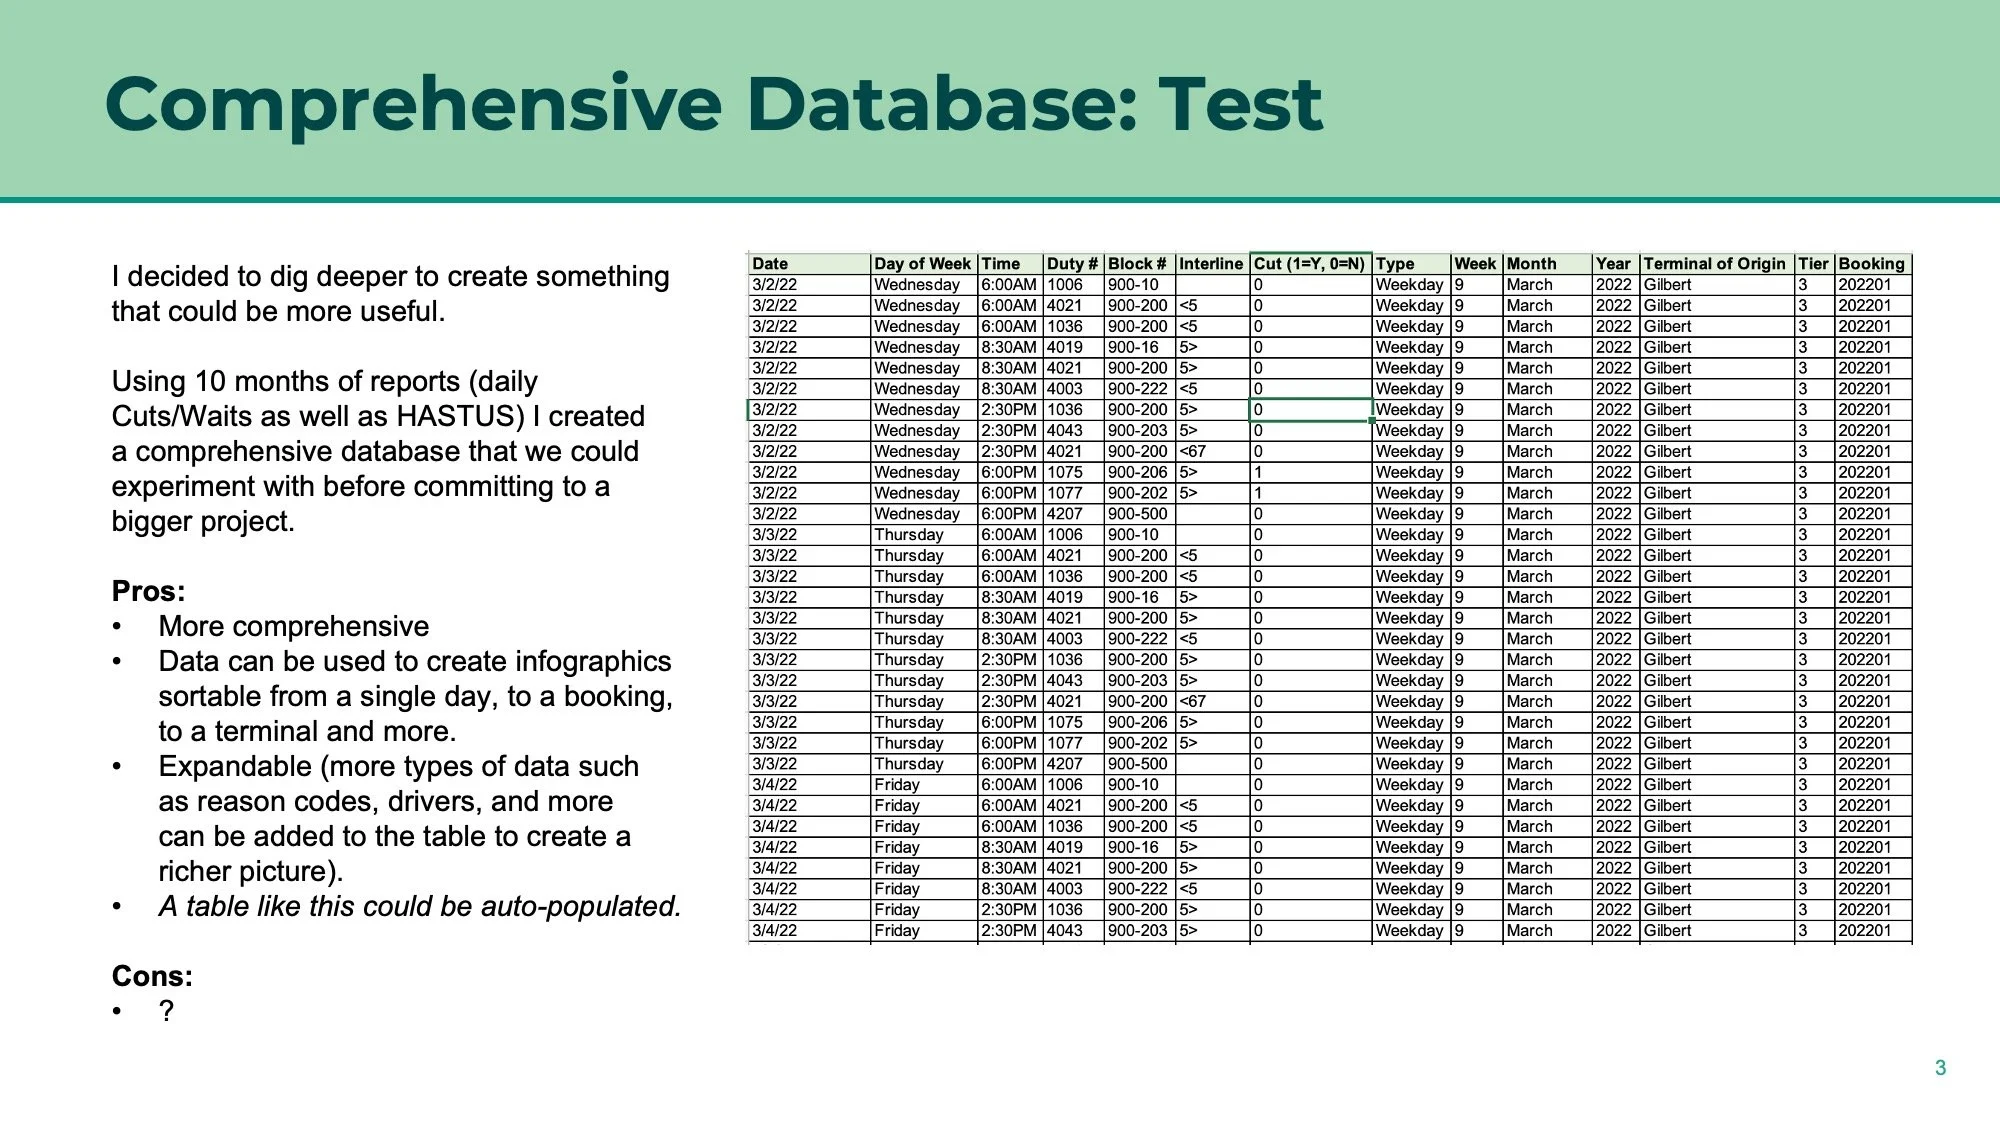
I was asked to create a spreadsheet that would take all of our cut runs (buses that didn’t make it out onto the road) and depict them in a way that was easy to interpret at a glance. In creating this chart that was purely for visual review and couldn’t really be used to provide any long term analysis I started to dig deeper to see if there was a better solution. Because some of the data was manually entered and other data was generated with onboard software there were lots of issues. I compiled and analyzed 10 months of data and presented these discrepancies to our Data Analysts and Operations division with the goal of figuring out how to pinpoint what was going on.
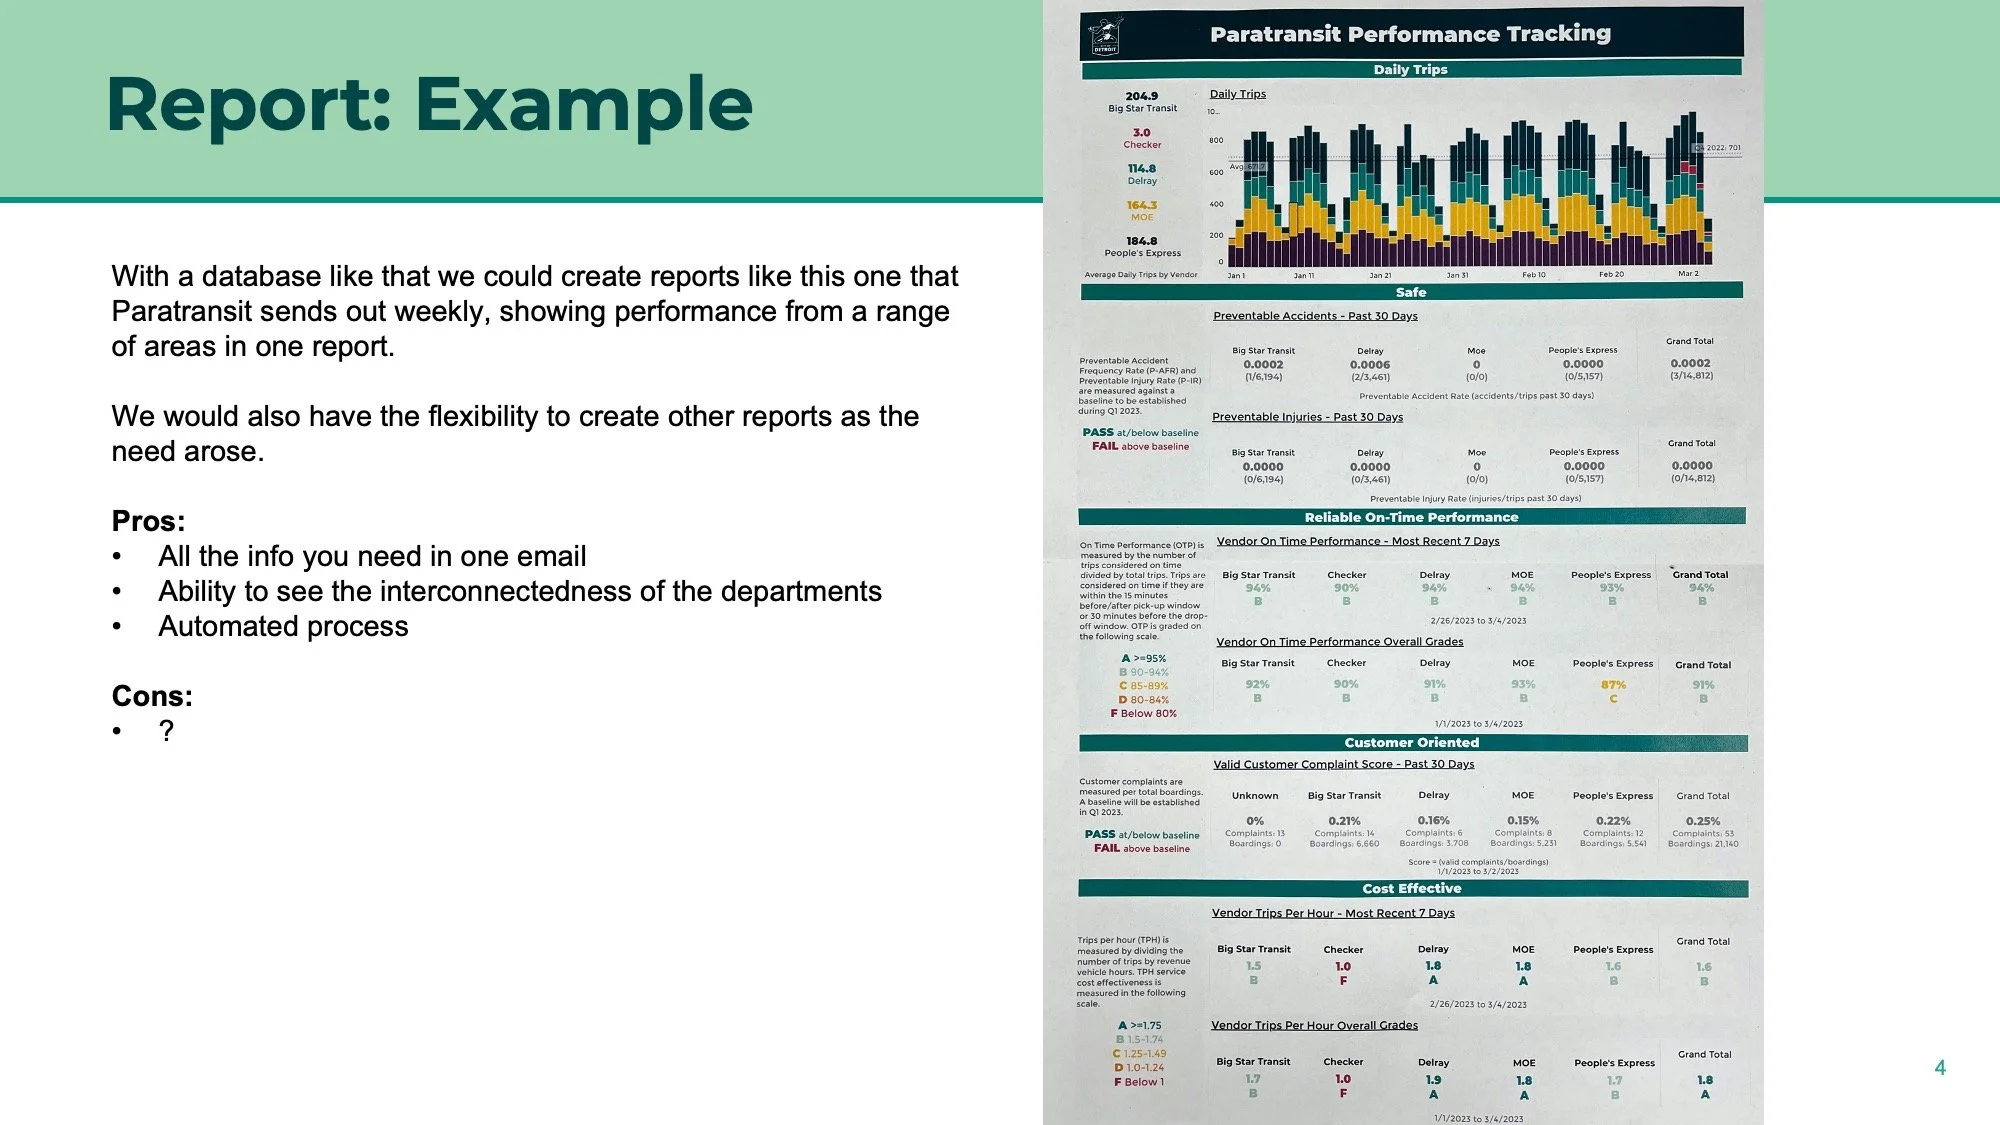
Following the presentation, some other departments got involved and a larger conversation about getting consistently accurate data was sparked across the organization. Our Data Analysts are continuing to work with Operations and our software provider to resolve these issues.


Bus Schedule Distribution
In order to better serve the community, it’s important that we provide people with as many resources as possible to make using transit more convenient. One of the ways we do this is through our bus schedule distribution system. This year I reinstated distribution, which had lapsed during COVID, was able to take our old distribution list and update it so that we now reach almost 100 locations including almost all low-income and senior apartment buildings in the city, as well as rec centers, Detroit at Work job placement offices, universities/colleges, public libraries and soup kitchens.
In taking over this project I used ArcGIS Pro to take the updated list of locations I had compiled, create one mile buffers around each location and then run an analysis to see which bus routes were within a mile of each drop-off location so we could be more intentional with the distribution of schedules. In addition to bus schedules, we also provide laminated flyers with all QR codes / links to DDOT related apps and information on how to sign up for our Paratransit service.

